#19 (11/01/2023)

Power Spectrum

We cannot draw the graph the Fourier transform of f(x), F(ω), since it is, in general, a complex function. However, we can visualize the Fourier transform if we look at the absolute value of F(ω). Thus, the power spectrum, P(ω), is defined as
P(ω) = F(ω)

F(ω)
 
= |F(ω)|2.
(1)
Note that
P(ω) = P(−ω).
(2)
An example of power spectrum is a spectrum equalizer found in DSP software (see below).
equalizer.jpg

Parseval's theorem


−∞ 
f(x) g(x) dx = 1

2 π


−∞ 

F(ω)
 
G(ω) dω1,
(3)
where F(ω) and G(ω) are the Fourier transforms of f(x) and g(x), respectively, and the overbar is the complex conjugate.

Proof:

The Fourier transform of f(x) is
F(ω) =


−∞ 
f(x) ei x ω dx,
and its complex conjugate is

F(ω)
 
=


−∞ 
f(x) ei x ω dx,
so
1

2 π


−∞ 

F(ω)
 
G(ω) dω
=
1

2 π


−∞ 


−∞ 
f(x) ei x ω dx
G(ω) dω
=


−∞ 

1

2 π


−∞ 
G(ω) ei x ω dω
f(x) dx
=


−∞ 
f(x) g(x) dx.
(4)
As a special case of Eq.(3), if we let g(x) ≡ f(x), it follows


−∞ 
{f(x)}2 dx = 1


−∞ 
|F(ω)|2 dω.
(5)
Equation (5) is known as the Parseval identity. Note that the both sides of Eq.(5) represent the power of the corresponding functions.

Auto-correlation (Wiener-Khinchin's theorem)

The auto-correlation, R(x), of a function, f(x), represents a correlation between two points separated by x and is defined by

R(x) ≡


−∞ 
f(y) f(y+x) dy,
(6)
i.e. comparing f at y and y+x (separated by x) and taking the average over y. Recalling that the convolution between f(x) and g(x) is defined as

f(x) ∗g(x) ≡


−∞ 
f(xy) g(y) dy,
(7)
it can be shown, by setting g(x) ≡ f(−x), that
R(x) = f(x) ∗f(−x).
(8)

Proof:


f(x)*f(−x)
=


−∞ 
f(xy) f(−y) d y
=
(Change the variable from y to z byyz)
=

−∞

 
f(x+z) f(z) d (−z)
=


−∞ 
f(x+y) f(y) dy
=
R(x).
(9)

Wiener-Khinchin Theorem

The Fourier transform of the correlation function, R(x), is the power spectrum, P(ω), of f(x).

F(R(x)) = P(ω).

Proof:

Note that
F(f(−x))
=


−∞ 
f(−x) ei ωx dx
=


−∞ 
f(x) ei ωx dx
=

F(f(x))
 
.
Therefore,
F(R(x))
=
F(f(x)*f(−x))
=
F( f(x)) F( f(−x))
=
F( f(x))

F(f(x))
 
=
| F( f(x))|2
=
P(ω).
Using the auto-correlation function to obtain the power spectrum is preferred over the direct Fourier transform as most of the signals have very narrow bandwidth.

Example:


f(x)=


1
|x| < 1
0
|x| > 1
recpulse.jpg

White noise, Pink noise, Brownian noise

correlation.jpg
If P(ω) is independent of the frequency, it is called white noise. If P(ω) is approximately proportional to 1/f ( = 1/ω), the original data is called pink noise, 1/f noise or fractal noise and if P(ω) is approximately proportional to 1/f2, it is called brownian (red) noise.
White noise

Pink noise

Brownian (red) noise

Another site

Application of Fourier Transforms (Computed Tomography and Radon transforms)

Fourier Transforms in 2D


F. T.
I. F.T
1D
F(ξ) =


−∞ 
f(x) ei ξx dx
f(x) = 1


−∞ 
F(ξ)ei ξx d ξ
2D
F(ξ, η) ≡


−∞ 


−∞ 
f(x, y) ei ( ξx + ηy) dx dy
f(x, y) = 1

(2 π)2


−∞ 


−∞ 
F(ξ, η)eix + ηy) dξdη
(10)

Radon Transforms

The Radon transform is defined as an integral of a two-dimensional density function, f(x, y), along the y′ axis as

R(x′, θ) ≡


−∞ 
f(x, y) dy′,
(11)
where the (x′, y′) coordinate system is a rotation from the (x, y) coordinate system by θ given by


x
y


=


cos θ,
sin θ
− sin θ,
cos θ


x
y


.
(12)
radon.jpg
Note that R(x′, θ) depends on x′ and θ.
The Fourier transform for a two variable function, f(x, y), is defined as
F(ξ, η) ≡


−∞ 


−∞ 
f(x, y) ei ( ξx + ηy) dx dy.
(13)
If the polar coordinate system, (ρ, θ), is introduced into the (ξ, η) system with
ξ = ρcos θ,     η = ρsin θ,
(14)

ξx + ηy = ρ(x cos θ+ y sin θ) = ρx′.
(15)
So
F(ξ, η)
=


−∞ 


−∞ 
f(x, y) ei ρx dx dy
=


−∞ 


−∞ 
f(x, y) ei ρx
∂(x, y)

∂(x′, y′)

dxd y
=


−∞ 


−∞ 
f(x, y) ei ρx dxd y
=


−∞ 


−∞ 
f(x, y) dy
ei ρx dx
=


−∞ 
R(x′, θ) ei ρx dx′.
(16)
Thus, the Fourier transform of f(x, y) can be obtained by multiplying ei ρx on the Radon transform of f(x, y) and integrating the result with respect to x′. The original image can be restored by the inverse Fourier transform defined as
f(x, y) = 1

(2 π)2


−∞ 


−∞ 
F(ξ, η)eix + ηy) dξdη.
(17)
This is the principle of CT (computed tomography).
ctscanner.jpg

Trivial example

radon_ex.jpg
The Radon transform of the function,
f(x, y) ≡


1
x2 + y2 ≤ 1
0
otherwise
(18)
is
R(x′, θ) = 2


1 − x2
 
.
(19)
radon1.jpg
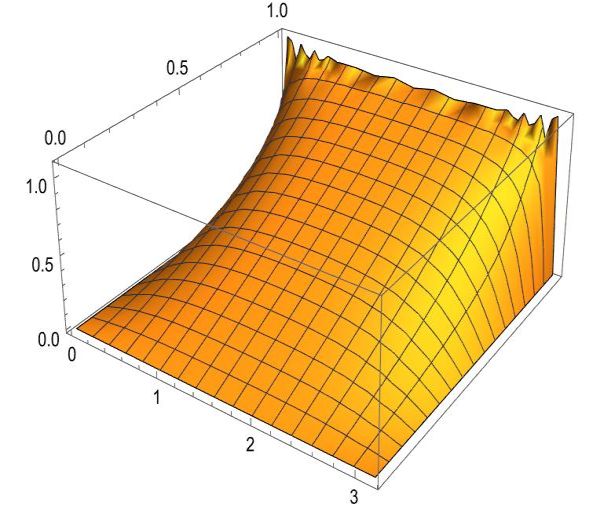
Figure 1: Radon transform R(x′, θ) of f(x, y).
Therefore, the Fourier transform of f(x, y) is given by
F(ξ, η)
=


−∞ 
2


1 − x2
 
ei ρx dx
=

1

−1 
2


1 − x2
 
ei ρx dx
=
2 πJ1(ρ)

ρ
,
(20)
where J1(ρ) is the Bessel function of the first kind.
radon2.jpg
Figure 2: Fourier transform of R(x′, θ).
The inverse Fourier transform of the above is
f(x, y)
=
1

2


0 


0 
2 πJ1(ρ)

ρ
ei (x ξ+ y η)ρ dρ dθ
=
1

4 π2

2 π

0 


0 
2 πJ1(ρ)

ρ
ei ρ(x cos θ+ y sin θ) ρ d ρ dθ
=
=


1
x2 + y2 < 1
0
x2 + y2 > 1
(21)
radon3.jpg
Figure 3: Inverse Fourier transform of F(ρ, θ).

Example:

monalisabw.jpg
Original image
monalisa_radon.jpg
Radon transform
monalisa_inverse_radon.jpg
Inverse Radon transform


Footnotes:

1Note that


−∞ 

F(ω)
 
G(ω) dω =


−∞ 
F(ω)

G(ω)
 
dω.


File translated from TEX by TTH, version 4.03.
On 05 Nov 2023, 16:25.