- Draw a graph of sin(x3) for − π < x < π.
- Draw a graph of (sin x, sin 2x, sin 3x) for 0 < x < 2π together.
- Draw a 3-D plot of x*x + sin y
- Issue the following command and plot the result.
complex(x,y) = x*{1,0}+y*{0,1}
mandel(x,y,z,n) = (abs(z)>2.0 || n>=1000) ? n : mandel(x,y,z*z+complex(x,y),n+1)
set xrange [-1.5:0.5]
set yrange [-1:1]
set logscale z
set isosample 50
set hidden3d
set contour
splot mandel(x,y,{0,0},0) notitle
- Write a C program on omega.uta.edu to generate the following table of
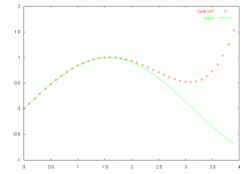
from x = 0 to x = 4.0 with an increment of 0.1, and store the result to a separate file, table.dat.f(x) = 1 − x2/2 + x4/24 0.000000 0.000000 0.100000 0.099833 ................ ................ 3.500000 0.730990 3.600000 0.862848 3.700000 1.036497 3.800000 1.257597 3.900000 1.532184 4.000000 1.866667
- Transfer the above date file from omega.uta.edu to a local folder. Launch
gnuplot to read the file, table.dat,
and plot the data along with cos x. This way, you can find out how good
approximating cos x by the first three terms of Taylor series is.
The graph should look like

- Refer to the lecture note.
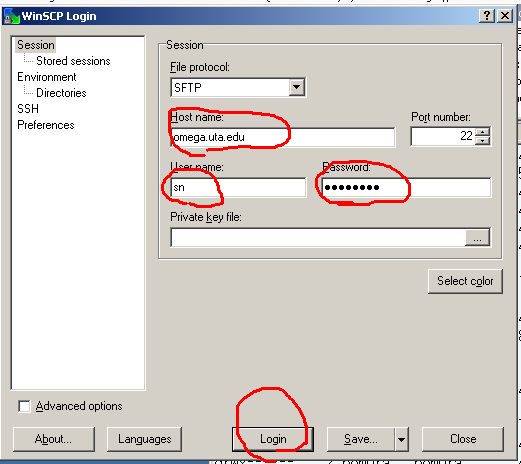
- Use WinSCP to transfer the file from your omega account to your home folder.
-
When you launch GNUPlot on your local PC, you need to have
the default directory changed to the directory where you stored table.dat.
Look for
 and enter your home directory.
-
plots data from file along with x3− x.plot "junk.dat", x**3-x


- Save each file to your folder by Right Click, Save Picture as.
- Download mergegif64.exe (32 bit version here) and save the file to the same folder as above.
-
mergegif -5 01.gif 02.gif 03.gif 04.gif 05.gif > animation.gif
- Try different delay time (-n).
- For submission, send the gif file as an attachment.


