


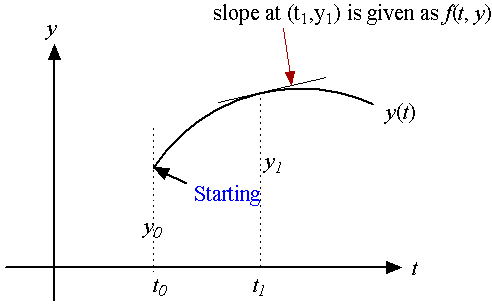
| (1) |
| (2) |
| (3) |
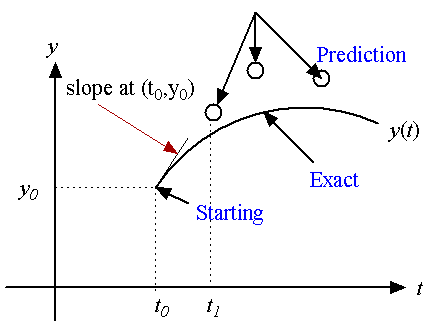 Equation (3) can be written as
| (4) |
| (5) |
| (6) |
#include <stdio.h>
#include <math.h>

double f(double t, double y)
{
 return y;
}

int main()
{
 double h = 0.1, y, t;
 int i;

 t = 0.0; y = 1.0;

for (i = 0; i<= 10; i++)
 {
   printf("t=%f %f %f\n", t, y, exp(t));
   y = y + h * f(t,y);
   t = t + h;
}
 return 0;
}
|

|
| (7) |
#include <stdio.h>
#include <math.h>

double f(double t, double y)
{return y;}

main()
{
double h=0.1, t, y, k1,k2,k3,k4;
int i;

/* initial value */
t=0.0; y=1.0;

for (i=0; i<=10; i++)
{

 printf("t= %lf rk= %lf exact=%lf\n", t, y, exp(t));
 k1=h*f(t,y);
 k2=h*f(t+h/2, y+k1/2.0);
 k3=h*f(t+h/2, y+k2/2.0);
 k4=h*f(t+h, y+k3);
 y= y+(k1+2.0*k2+2.0*k3+k4)/6.0;
 t=t+h;
}
return 0;
}
|
| (8) |
|
|
|
#include <stdio.h>
#include <math.h>

double f1(double t, double y1, double y2)
{return y2;}

double f2(double t, double y1, double y2)
{return -y1;}

int main()
{
double h=0.02, y1, y2, t;
int i;

y1=0.0; y2=1.0;
t=0.0;

for (i=0; i<=100; i++)
{
 /*printf("t= %lf %lf %lf\n", t, y1, sin(t));*/
 printf("%lf %lf %lf\n", t, y1, sin(t));
 y1=y1+h*f1(t,y1,y2);
 y2=y2+h*f2(t,y1,y2);
 t=t+h;
}
return 0;
}
|
|
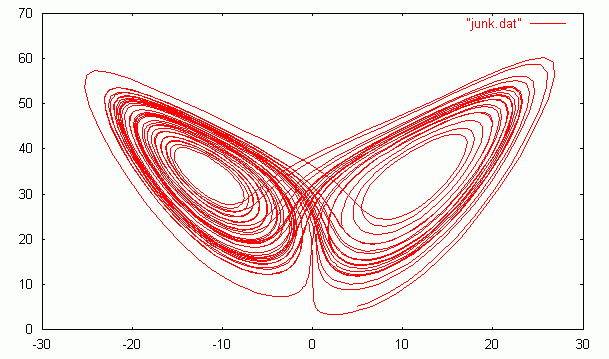
#include <stdio.h>
#include <math.h>
#define P 16.0
#define b 4.0
#define R 35.0

double f1(double u, double v, double w)
{return P*(v-u);}

double f2(double u, double v, double w)
{return -u*w+R*u-v;}

double f3(double u, double v, double w)
{return u*v-b*w;}

int main()
{
double h, t, u, v, w;
int i;

/* initial value */
t=0.0; h=0.01;
u=5.0; v=5.0; w=5.0;

for (i=0; i< 3000; i++)
{
 u=u+h*f1(u,v,w);
 v=v+h*f2(u,v,w);
 w=w+h*f3(u,v,w);
 printf("%lf %lf\n", u, w);
 t=t+h;
}
 return 0;
}
|
c:\tmp\gcc -o lorenz.exe lorenz.c c:\tmp\lorenz.exe > lorenz.dat (Launch gnuplot) Change directory to c:\tmp plot "lorenz.dat" with line |
 Here is a code in Matlab/Octave.
P=16;b=4;R=35; f1=@(u,v,w) P*(v-u); f2=@(u,v,w) -u*w+R*u-v; f3=@(u,v,w) u*v-b*w; t=0;h=0.01; u=5;v=5;w=5; for i=1:1:3000 u=u+h*f1(u,v,w); v=v+h*f2(u,v,w); w=w+h*f3(u,v,w); uu(i)=u;vv(i)=v; t=t+h; end; plot(uu',vv'); |
|
f=@(t,y) -t*t*y; tspan=linspace(0,5,100); y0=1; [t,y]=ode45(f, tspan, y0); plot(t,y); |
|
f=@(y,t) -t*t*y; tspan=linspace(0, 3, 100); y0=1; sol=lsode(f, y0, tspan); plot(tspan, sol); |