


#include <stdio.h>
int main()
{
  float a =20.0, b=50.0;
  float *pa, *pb;
  pa=&a; pb=&b;
  printf("%f %f\n", a, b);
  printf("%f %f\n", *pa, *pb);
  return 0;
}
|
| Variable name | Machine absolute address | Contents |
| … | 100 | … |
| … | 101 | … |
| a | 102 | 20.0 |
| … | … | … |
| b | 150 | 50.0 |
| … | 151 | … |
| … | … | … |
| pa | 200 | 102 |
| … | … | … |
| pb | 220 | 150 |
#include <stdio.h>
int main()
{
  int a=10;
  printf("Address of a=%d\n", &a);
  return 0;
}
|
#include <stdio.h>
int main()
{
  int a=10;
  printf("Address of a=%p\n", &a);
  return 0;
}
|
#include <stdio.h>
int main()
{
  int a[]={100,2,-56};
  printf("%p\n", &a[0]);
  printf("%p\n", &a[1]);
  printf("%p\n", &a[2]);
  return 0;
}
|
#include <stdio.h>
int main()
{
  double a[]={100,2,-56};
  printf("%p\n", &a[0]);
  printf("%p\n", &a[1]);
  printf("%p\n", &a[2]);
  return 0;
}
|
#include <stdio.h>
int main()
{
  float a=20.0;
  float *pa;

  pa=&a;

  printf("%p\n", pa);
  printf("%p\n", &a);

  return 0;
}
|
#include <stdio.h>
int main()
{
  float a=20.0;
  float *pa;

  pa=&a;

  printf("%f\n", *pa);
  printf("%f\n", a);
  return 0;
}
|
#include <stdio.h>
int main()
{
  float a=20.0;
  float *pa=&a;

  a=30.0;
  *pa = 40.0;
  printf("%f\n", *pa);
  printf("%f\n", a);
  return 0;
}
|
#include <stdio.h>
int main()
{
  float a=10.0,b=20.5;
  float *pa, *pb;

  pa=&a; pb=&b;

  printf("Address of a=%p\n", &a);
  printf("Address of b=%p\n", &b);
  printf("\n");
  printf("Pointer pa=%p\n", pa);
  printf("Pointer pb=%p\n", pb);
  printf("\n");
  printf("Value pointed by pa=%f\n",*pa);
  printf("Value pointed by pb=%f\n",*pb);
  return 0;
}
|
#include <stdio.h>

void tentimes(float a)
{
a = 10.0*a;
}

int main()
{

 float b=20;
 tentimes(b);
 printf(" b = %f\n", b);
 return 0;
}
|
#include <stdio.h>

void swap(float x, float y)
{
 float tmp;
 tmp = x;
 x = y;
 y = tmp;
}

int main()
{
 float a=10.0, b=50.0;

 printf("Old a = %f and old b = %f\n",a,b);

 swap(a, b);

 printf("New a = %f and new b = %f\n", a,b);

 return 0;
}
|
#include <stdio.h>

void swap(float *pa, float *pb)
{
 float tmp;
 tmp=*pa;
 *pa=*pb;
 *pb=tmp;
}

int main()
{
 float a=10.0, b=50.0;

 printf("Old a = %f and old b = %f\n",a,b);

 swap(&a,&b);

 printf("New a = %f and new b = %f\n", a,b);

 return 0;
}
|
#include <stdio.h>
void twice(float a)
{
  a = 2.0 * a;
}

int main()
{
 float a = 20.0;
 twice(a);
 printf("a= %f\n", a);
 return 0;
}
|
#include <stdio.h>
void twice(float *pa)
{
 *pa = 2.0* *pa;
}
int main()
{
  float a = 20.0;
  twice(&a);
  printf("a = %f\n",a);
  return 0;
}
|
#include <stdio.h>
int main()
{
  int a=3, b=2,*pa=&a, *pb=&b;

  &b = pa;
  pa = a;
  *pa = pb;
  pa = *pb;
  return 0;
}
|
#include <stdio.h>
int main()
{
	float  a[3]={1.0, 2.0, 3.0}, *pa=&a[0];
	double b[3]={1.2345670, 2.009876555, 3.14159265}, *pb=&b[0];


	printf("float  %p %p %p\n", pa, pa+1, pa+2);
	printf("double %p %p %p\n", pb, pb+1, pb+2);

	return 0;

}
|
#include <stdio.h>

int main()
{
 int a[3]={1, 2, 3};
 return 0;
}
|
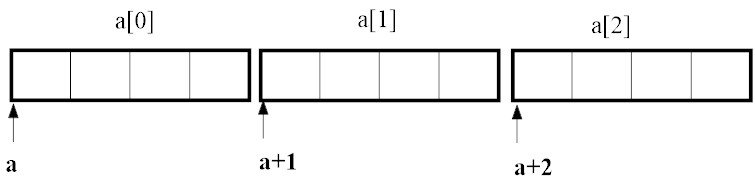
| Array access | Pointer equivalent |
| a[0] | *a |
| a[1] | *(a+1) |
| a[2] | *(a+2) |
|
 Execute the following program and examine the result:
#include <stdio.h>

int main()
{
 float a[3]={1.0, 2.0, 3.0};
 printf("%f\n", *a);
 printf("%f\n", a[0]);
 printf("\n");
 printf("%f\n", *(a+2));
 printf("%f\n", a[2]);
 return 0;
}
|
#include <stdio.h>
void twice(float *a)
{
 int i;
 for (i = 0; i < 3; i++)
 a[i] = 2 * a[i];
}

int main()
{
 float b[3] = {1.0, 2.0, 3.0};
 int i;
 twice(b);
 for (i = 0; i < 3; i++) printf("%f\n", b[i]);
 return 0;
}
|
#include <stdio.h>
void twice(float a[3])
{
 int i;
 for (i = 0; i < 3; i++)
  a[i]=2*a[i];
}

int main()
{
	float b[3] = {1.0, 2.0, 3.0};
	int i;
	twice(b);
	for (i = 0; i < 3; i++) printf("%f\n", b[i]);
        return 0;
}
|
|
|
#include <stdio.h>

int main()
{
float a, b;
printf("%f\n", a=20.0);

b=a=30.0;

printf("%d\n", a==20.0);
return 0;
}
|
a=b=20; |
|
#include <stdio.h>
int main()
{
  int a=3, b=5;

  printf("%f\n", a/b);
  return 0;
}
|
#include <stdio.h>
int main()
{
  int a=3, b=5;

  printf("%f\n", 1.0*a/b);
  return 0;
}
|
#include <stdio.h>
int main()
{
  int a=3, b=5;

  printf("%f\n", a/b*1.0);
  return 0;
}
|
#include <stdio.h>
int main()
{
  int a=3, b=5;

  printf("%f\n", (float)a/b);
  return 0;
}
|
$ a.out | more
$ gcc -lm myprogram.c -o myprogram |
#include <stdio.h>

#define PI 3.141592	/* define pi */

int main()
{
float a;
printf("Enter radius = ");
scanf("%f", &a);
printf("The area of circle is=%f \n", a*a*PI);
return 0;
}
|
| x[0] | x[1] | x[2] | x[3] | x[4] | x[5] |
| 45 | 67 | 12 | 34 | 25 | 39 |
| x[0] | x[1] | x[2] | x[3] | x[4] | x[5] |
| 45 | 67 | 12 | 34 | 25 | 39 |
| x[0] | x[1] | x[2] | x[3] | x[4] | x[5] |
| 45 | 12 | 67 | 34 | 25 | 39 |
| x[0] | x[1] | x[2] | x[3] | x[4] | x[5] |
| 45 | 12 | 34 | 67 | 25 | 39 |
| x[0] | x[1] | x[2] | x[3] | x[4] | x[5] |
| 45 | 12 | 34 | 25 | 67 | 39 |
| x[0] | x[1] | x[2] | x[3] | x[4] | x[5] |
| 45 | 12 | 34 | 25 | 39 | 67 |
#define N 6 for (i=0; i < N-1; i++) if (x[i] > x[i+1]) swap(&x[i], &x[i+1]) |
#include <stdio.h>
#define N 6

void swap(float *a, float *b)
{
float tmp;
tmp=*a;
*a=*b;
*b=tmp;
}

int main()
{

float a[N]={45, 67, 12, 34, 25, 39};
int  i, j;

for (j=1; j < N; j++)
 {for (i=0; i< N-j; i++)
   if ( a[i]> a[i+1]) swap(&a[i], &a[i+1]);
  }

 for (i=0;i<N; i++) printf("%f ", a[i]);
   printf("\n");
 return 0;
}
|
|
|
|
|
|
|
"ABC" (double quotation) is for a string of characters and is an array (pointer).
|
#include <stdio.h>
int main()
{
  char s[3] = "ABC";

  printf("%s\n", s);
  return 0;
}
|
#include <stdio.h>
int main()
{
char str[100];
printf("Enter string = ");
scanf("%s", str);
printf("%s\n",str);
return 0;
}
|
#include <stdio.h>
#include <string.h>
int main()
{
    char c1[] = "ABCDE", c2[6];

    strcpy(c2,c1);
    printf("%s\n",c2);
    return 0;
}
|
#include <stdio.h>
#include <string.h>

int main()
{
    char s[100];

    printf("Enter \"MAE2360\" = ");
    scanf("%s", s);

    if (strcmp(s,"MAE2360") == 0) printf("MAE2360 was entered correctly.\n");

    else printf("Wrong. %s was entered.\n",s);
    return 0;
}
|
#include <stdio.h>
#include <string.h>
int main()
{
char c[50];
printf("Enter string = ");
scanf("%s", c);
printf("You entered %s\n", c);
printf("Its length is %d\n", strlen(c));
return 0;
}
|
| Notion | Meaning |
| $ a.out > filename | output to file |
| $ a.out >> filename | append output to file |
| $ a.out < filename | get input from file |
$ gcc myprogram.c $ a.out > result.dat $ more result.dat |
$ gcc myprogram.c $ a.out < data.dat > result.dat $ more result.dat |
c:\dir > filelist.dat |
|
|
|
|
$ gcc -lm add.c -o add $ junk (interactive session) |
$ gcc -lm add.c -o add $ junk 3421 8756 (executes program to manipulate 3421 and 8756 and prints results) |
int main(int argc, char *argv[]) |
#include <stdio.h>

int main(int argc, char *argv[])
{
  int i;

  printf("Number of parameters = %d\n", argc);

  for(i=0; i<argc; i++)
    printf("%d: %s\n", i, argv[i]);

  return 0;
}
|
#include <stdio.h>
#include <stdlib.h>

int main(int argc, char *argv[])
{
printf("%d\n", atoi(argv[1]));
return 0;
}
|
#include <stdio.h>
#include <stdlib.h>

int main(int argc, char *argv[])
{
int i;
int b[100]; /* reserve ample space*/

for (i=1; i< argc; i++)
b[i]=atoi(argv[i]);

for (i=1; i< argc ; i++)
 printf("%d\n", b[i]);

return 0;
}
|